
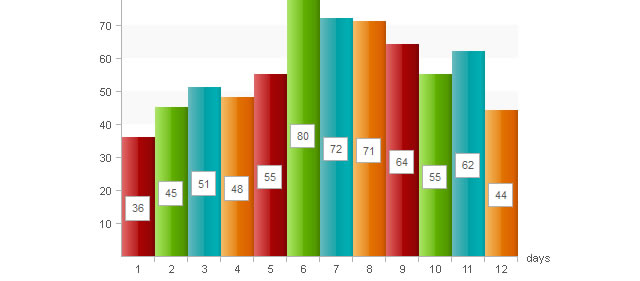
CSS3 Charts
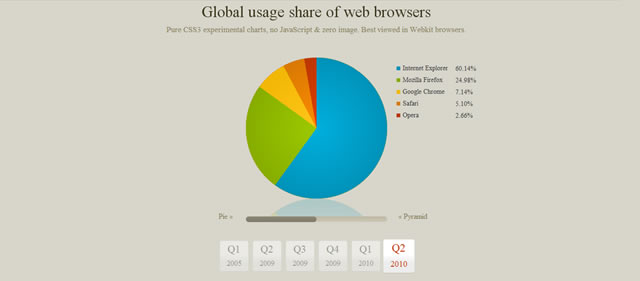
This pure CSS3 interactive chart did very well in Smashing Magazines recent CSS3 design contest, it came, not surprisingly, first. No tutorial with this one, but you can download the source files, allowing you to reverse engineer the entire process.
CSS3 Charts
View the Demo
Flexible Bar Graphs using CSS
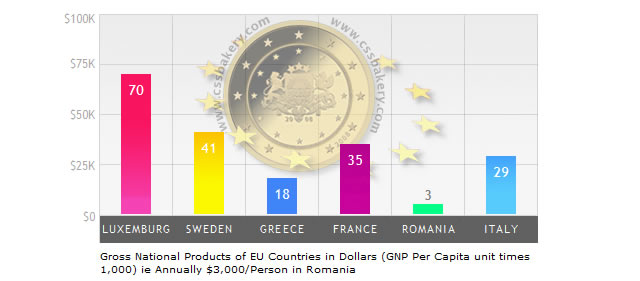
In this in-depth tutorial, you’ll be constructing a flexible bar graph using good old traditional CSS and HTML. The key concepts that will be covered are: the background property, absolute positioning, CSS selectors, first-child, CSS sprites, containing block, cascade, and styling of unordered lists.
Flexible Bar Graphs using CSS
Flexible Bar Graphs using CSS
CSS Stacked Bar Graphs
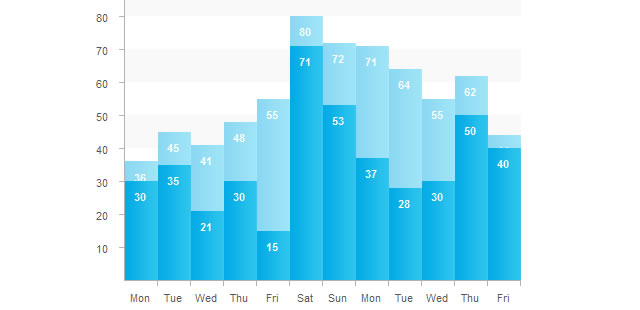
This tutorial offers a unique and creative variant on CSS Globes’ famous pure CSS data chart (you will find it below) by explaining how to create a chart with stacked columns.
CSS Stacked Bar Graphs
View the Demo
CSScharts

Pure Css Line Graph
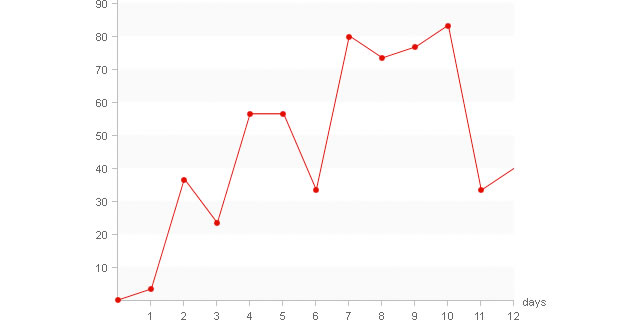
This chart tutorial tackles the not as generally used and very difficult to build line graph. Even if you are not a fan of line graphs and data visualization in general, you should still read this article and think of it as a CSS experiment and perhaps learn a thing or two about CSS sprites and positioning.
Pure Css Line Graph
View the Demo
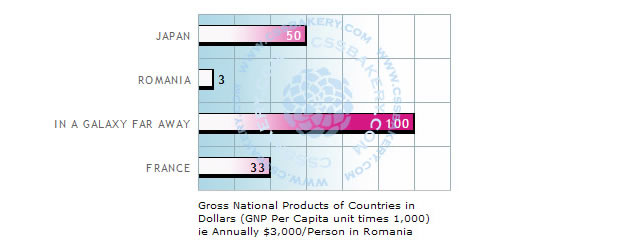
Pure Css Data Chart
This tutorial explains that a chart is a two dimensional object. Thus, the best structural and semantical choice is to use a definition list. Although the list is linear, you could interpret definition titles (dt elements) as items on x axis and definition descriptions (dd elements) as values on y axis.
Pure Css Data Chart
View the Demo
Pure CSS Horizontal Bar Graphs
CSS Bar Charts – Styling Data with CSS3 and Progressive Enhancement

This article discusses and demonstrates that using some rich CSS3 and progressive enhancement, you can really start pushing the display and presentation of normally boring documents.
CSS Bar Charts – Styling Data with CSS3 and Progressive Enhancement
View the Demo
0 comments:
Post a Comment